To share this page click on the buttons below;
Classification
I will talk about classification using a simple example. The example is completely made up, so that it has no connection with the real world (and if it has it is only by chance).
Suppose that we want to classify the American electors between Republicans and Democrats. We arbitrary decide that to make this classification we are going to use 2 parameters: the salary and the age. To make it straight the output of our classification is the party people are voting for and the input of our classification are the salary and the age of each elector. In other words we would like to see if we can build a classifier that separate Republican electors and Democrat electors using only the age and the salary. Likely that is obviously impossible because to classify electors accurately we need much more inputs, but in this made up example we will suppose that feasible.
So we start our interviews: How old are you? How much do you earn? For whom do you vote?. Suppose that we made 10 interview and at end we put our data into a diagram. That is what we got:
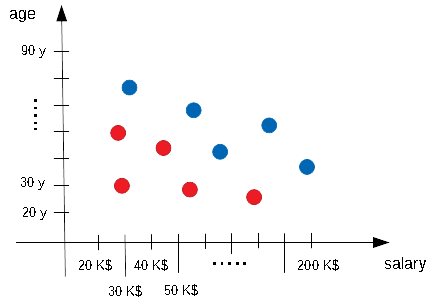
Blue spots indicate a Republican elector, red spots a Democrat elector, on the horizontal axis we have the salary, on the vertical axis we have the age of the elector.
Now the question: can we separate red spots and blue spots? Well, yes, in a very straight way (that is the advantage to use made up examples!). In fact we can easily separate our two elector classes with a straight line. The following diagram shows one of the possible straight line that is able to separate our electors.
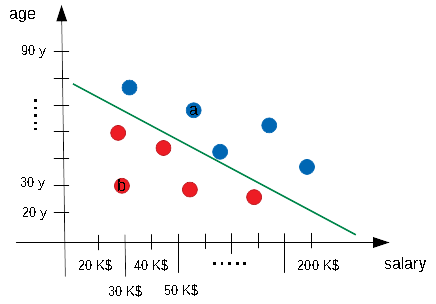
That line is actually a classifier.
Suppose in fact that we use the variable \(x_1\) to indicate the salary and the variable \(x_2\) to indicate the age. Any possible straight line can be written in the form:
$$ w_1 \cdot x_1 + w_2 \cdot x_2 + b = 0 $$
where \(w_1, w_2\) and \(b\) are the parameters of our straight line (ie changing these parameters will allow us to draw whatever line we desire). Suppose for example that our green line hits the vertical axis on the age of 80 years and the horizontal axis on the salary of 300 K$ (I forgot to mention that 300 K$ means 300 000 $, I used the "Kilo" prefix so that as 1 Km is 1000 meters, 1 K$ is 1000 $). With that assumption our green line can be written in the form:
$$ 80 \cdot x_1 + 300000 \cdot x_2 - (80 \cdot 300000) = 0 $$
So we have:
- \(w_1 = 80\)
- \(w_2 = 300 000\)
- \(b = -(80 \cdot 300000) = -24000000\)
How this straight line is a classifier? In this simple way: let‘s ignore the \(= 0\) in our equation for the moment, for any couple of (salary,age) we put those values into the left part of our equation and we perform the calculation. If the result is \(> 0\) we classify our elector as Republican, if the result is \(< 0\) we classify our elector as Democrat.
You can easily verify that our classifier works fine with the electors we already interviewed. Suppose in fact that our elector a is 70 years old and it earn 69 000 $ per year (or 69 K$). If we put these values into the the first part of our equation we obtain \((80 \cdot 69000) + (300000 \cdot 70) -24000000 = 2520000\) which is actually greater that 0. Accordingly to what we said a couple of line above our elector should be Republican and in fact the elector a is Republican.
The same calculation can be done for the elector b, that is 30 years old and earns 30000 $ per year. Our calculation is \((80 \cdot 30000) + (300000 \cdot 30) -24000000 = -12600000\) so it is lower than 0: our classifier thinks that the elector b is Democrat as actually is.
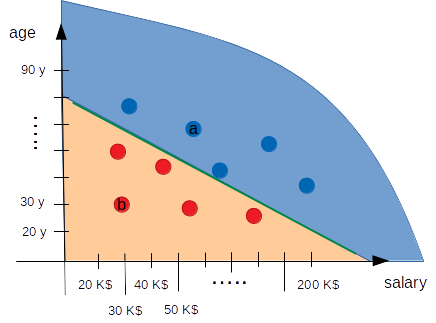
Our classifier performs well on the data we have (and it will also on other data I can make up, of course), what is interesting to notice (see the image below) is that our straight line (our classifier) separates the space in two areas, the upper zone is the Republican one, the lower is the Democrat one.
There are now 2 interesting questions: what is the relation between our linear classifier and a Neural Network? And: is there a way we can "learn" our classifier directly from the data we have?
The perceptron
The answer to the first question is that our classifier is a Neural Network. It is in fact the simplest Neural Network we can think and it has a special name: the perceptron.
I hope the image here below will immediately explain why the perceptron is the minimal possible Neural Network made actually just by 1 simple neuron with 2 inputs:
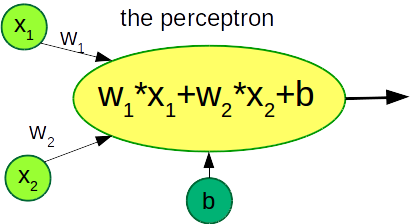
The perceptron is a linear classifier, this means that is able to separate classes using a linear function, graphically in our case a straight line. The perceptron is not limited to a 2 dimensional world: for example we can add an additional input to our electors classifier, let‘s consider for example the daily time the elector spent on the social media. In this case the perceptron will have the following equation:
$$ w_1 \cdot x_1 + w_2 \cdot x_2 + w_3 \cdot x_3 + b = 0 $$
This equation is still linear but it is now a plane into a 3 dimensional space (I will not try to draw that). Our electors spots will be scattered in this 3 dimensional space and our perceptron classifier will try to separate them with a plane. We can add additional inputs to improve our classifier with more information: the percpetron will become an hyperplane into a n-dimensional space. Nevertheless our perceptron will always try to separate our data with something linear. The perceptron is simple but it is only able to separate classes with a straight line or a plane (or an hyperplane which is impossible to visualize but it is still straight).
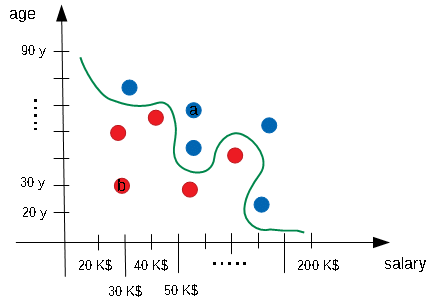
That is the limit of the perceptron. Suppose that our electors spots are now in different positions (see the image below). Now they are no longer separable with a straight line, but they are still separable by the "worm" green line. The perceptron will try to fit these data with a line but it will fail. For those situations we need more complex classifier, we need more complex Neural Networks able to introduce also non-linearities.
To share this page click on the buttons below;

