
To share this page click on the buttons below;
How the perceptron can learn
With this article I begins a series of articles to explain how the perceptron can learn in mathematical terms.
The first interesting question is: what does exactly mean that the perceptron can learn? The situation is the following: we have some data (in the example I described in a previous article the data are the interviews with electors), we suppose (in this case we know, because the problem is very simple) that our data are separable or classifiable with a linear model like a perceptron (in real situations we actually do not know which model fits our data so that we are going to make some attempts to find the one right for us). This means that we suppose to know the form of our model or (if you want) the form of our classifier: \(w_1 \cdot x_1 + w_2 \cdot x_2 + b\). Learning the classifier from data means that we want a procedure able to calculate the values of \(w_1\), \(w_2\) and \(b\) from the data we have. This values will be in some way the optimum ones (where optimum here means that they will be the best values that fits some mathematical constraint).
Here and in the following notes I am going to introduce some little changes to our simple perceptron. The purpose of these changes is to give it a form that will be more suitable for learning directly from the data.
The output of the classifier
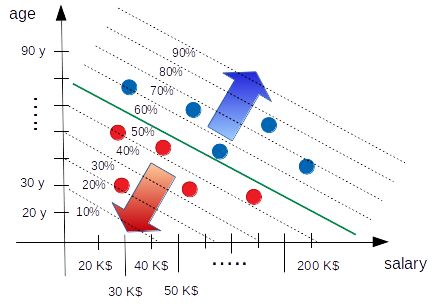
We need to have a little thinking about the output of our classifier. Let‘s quickly recap: we want to classify our Americans electors between Republicans and Democrats, that is our final goal. We want to develop a model that given some input data (in our case we choose the age and the salary of each elector) is able to classify (or to predict if you want) if the elector is Republican or Democrat. To develop this model we start from real data: we make some interviews so that at end we have a picture like the one showed in the previous note. That is the situation, but how we can represent the fact that an elector is Republican or Democrat? We need to answer to this question into a mathematical way. A sensible answer to this question can be given by introducing the probability that an elector is Republican (or Democrat).
In other words we want that the output of our model is the probability that an elector is Republican. Since we have only 2 classes, the probability that the elector is Democrat will be (1 - probability(of being Republican) because in our example we admit that each elector is always Republican or Democrat so that if it is not Republican it has to be Democrat (this is like the toss of a coin, if the probability of having head is 60% -our coin is fixed, of course- then the probability of having tail is 40%). In our case we have to remember that the probability of being Republican (or Democrat) is (has to be) function of the inputs of our model.
Suppose that our model outputs the probability of an elector of being Republican (but remember that once we have that we also have the probability of being Democrat) and suppose that the straight line of our perceptron is the boundary that separates Republicans and Democrats: how can be a sensible shape of our probability? We probably (that is the word, isn‘t it) want that our probability (of being Republican) is higher when we are in the upper right region (far from the perceptron line), in the same way we want that the probability (of being Republican) is very slow in the lower left region. That is due to the fact that we are modeling the boundary with our straight line and if we suppose that our model (which is the line) is good, we must admit that further we go from the boundary and bigger has to be the probability of being or not being Republican. The situation across the line cannot be so much clear (because we are on the boundary) and so we expect that the probabilities around the line are next to 50%, but always function of the distance from that line. The situation can be visually expressed with the following diagram.
Is there a way we can translate the perceptron output as a probability? There is indeed and that is by adding an activation function: the sigmoid.
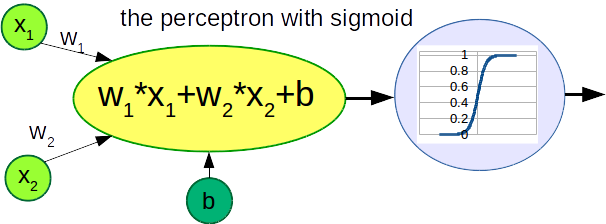
The sigmoid function is expressed by the following equation:
$$ \sigma(x) = \frac{1}{1+e^{-\alpha \cdot x}} $$
where \(\alpha\) is a positive parameter related to the slope of the function: the higher \(\alpha\) the steeper the function. The sigmoid suits our needs: it takes whatever input and it translates it into a number between 0 and 1 (which is the condition for being a probability).
There are a couple of reasons the sigmoid function is used. The most important is that this function compress the output of the perceptron to be between 0 and 1, but there are certainly other functions able to do that. Another important reason is related to the shape of the derivative of the sigmoid function and we will see that later on.
So now we have introduced the fact that a sensible way to see the output of our model is as the probability of an elector of being Republican. But how that is related to our original data? In our data there is not probability: we know exactly the party of each elector we interviewed. How we can encode that?
Actually in a very simple way: we assign to each Republican elector the value 1 (or 100% percent of probability of being Republican elector) and the value 0 to each Democrat elector (or the 0% of probability of being Republican elector). That is reasonable because we know what is the party those electors are voting for.
Here it is probably the time to remind our main goal: we are looking for a procedure to learn the model from the data, in other words we would like that our model fits the data we have. Fits here means that correctly classify the data we have, but it is not enough: we would like our model is in some way the best (we can actually draw a lot different straight line that correctly classify the data we have, which one we are going to pick?). Another important thing we have to remember is that the final output of our model will be probabilities.
What we need is a procedure to compare the performance of 2 models or to say it in a different way we need a way to express how much is wrong a model we have, along with a procedure to correct the model until it becomes right. That will be the argument of the next note.
To share this page click on the buttons below;