To share this page click on the buttons below;
Maximum likelihood
In this article I will introduce how we can compare the performance of two different models given the data we have. We are going to use the concept of maximum likelyhood.
The concept is very simple and practical, but as it often happens, it is sometimes presented with a lot of mathematical formalism that make it difficult to understand. The concept of maximum likelihood allow us to compare the performances of two different models. Suppose that I have two different models for our problem of classifying Americans electors, now I put in the first one my data (my age and my salary) and that model (let‘s label it with A) outputs that the probability that I am Republican is 75%. Then again I put my data into the second model (we are going to label that model with B) and the model says that the probability that I am Republican is 35%. Which model is the best? A or B?
It depends. It depends if I am a Republican or a Democrat elector. If I am Republican I am probably going to say that the best model is A, if I am a Democrat elector I would probably choose the model B as the best.
The maximum likelihood does exactly the same, assign a best score to the model that better fits the data we have. It does something better, it provides us with a formula which give us the right perception about how much our model is good.
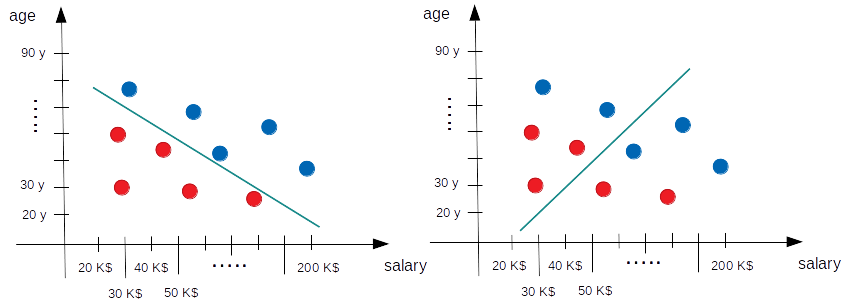
Let‘s apply this method to our example. Suppose that we have the following models (remember the models are just the straight lines).

Which one is the best? The answer is quite obvious: the one on the left because it correctly separates all the electors. But the question is: there is a mathematical way we can express that the left is the best? From a quantitative point of view I mean.
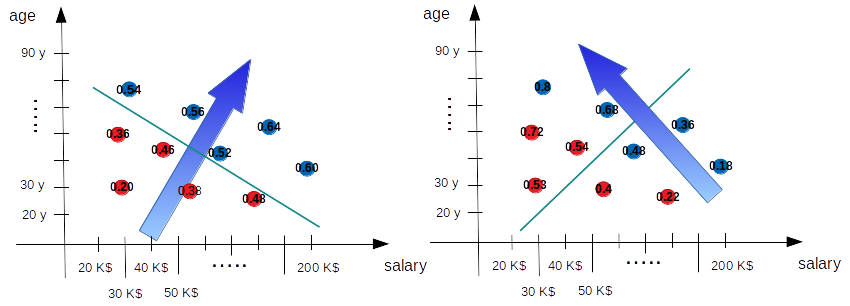
To answer this question we need to remember that our models output the probability of an elector of being Republican and this probability is higher when we go far from the straight line (into the Republican region) and very tiny if we move in the opposite direction (into the Democrat region). So that the probabilities our two models output must look like something in the following picture (where the arrow remember us the direction the probability of being Republican must increase and for each elector it is indicated the probability of being Republican, remember that this is valid also for red spots which are actually Democrat electors, so that on a Democrat spot it is written the probability of that elector of being Republican).

Now the interesting part: with those numbers we are able to calculate which is the probability of the whole situation our model is taking into account so far. Which is the probability that our models assign to all our electors of being what they actually are? If we suppose that the behavior of each electors is independent from the behavior of the others, the probability of all the 10 electors we have of being what they actually are is the product of each individual probability (remember that the probability of being Democrat is always 1 minus the probability of being Republican and in the diagram the number are always the probability of being Republican).
So for the model on the left we have:
    0.54     *
    0.56     *
    0.52     *
    0.60     *
    0.64     *
    (1-0.36) *
    (1-0.46) *
    (1-0.48) *
    (1-0.38) *
    (1 -0.20) = 0.0053823893
in which the first 5 values in the product are the probabilities of the 5 Republican electors of being Republican and the next five values are the probabilities of the Democrat electors of being Democrat.
For the model on the right instead we have:
    0.8      *
    0.68     *
    0.36     *
    0.48     *
    0.18     *
    (1-0.72) *
    (1-0.52) *
    (1-0.53) *
    (1-0.4)  *
    (1 -0.22) = 0.0005002166
What we just calculated is the likelihood of each model according the data we have (if you want, it is a measure of how much our model is matching the data). Which is the best model? The one on the left (we already knew that) because it has the maximum likelihood. Now we have a number that is actually giving us a quantitative information about how good each model is, which is what we were looking for. Best models are the ones with higher likelihood because they match in a better way the data we have.
If we were living in the perfect world of the math we would have just finished and we could move ourselves to the next step and see how we can use this value to get the parameters of the best model. But we are not in the math world: we are in the real one, here calculus are made with computers and computers have not an infinite precision, so we need to note another pair of things and to reformat the way we use to calculate the likelihood.
We have to notice that the likelihood is given by the product of probabilities which are all numbers lower than 1. By multiplying numbers lower than 1 we get numbers that become always smaller. Besides in real cases we have to deal with thousands and thousands of data. If we continue to multiply a lot of numbers lower than 0 on a computer we got very soon 0. We need to find a way to avoid multiplication.
Fortunately logarithms exist exactly for this reason: because they allow to transform product in sum. The logarithm of the product of a series of number is in fact the sum of the logarithm of each number. So we modify the way the likelihood is calculated with the sum of the logarithm of our probabilities. We obtain a different value (actually we obtain the logarithm of the likelihood value obviously) but it does not matter because we are looking for the maximum likelihood and if we find the maximum of the logarithm we are assured to find the maximum of the likelihood too. Usually we refer to this value as loglikelihood.
But we can get a little bit further and observe that since the probabilities are numbers between 0 and 1, then the logarithm of those number are all negative and so our final result is a negative number. To avoid to deal with negative number we can decide to sum up the negative of the logarithm of the probabilities. But now we have to pay attention: best models are the ones with higher loglikelihood, here we are taking the negative so now best model are the ones which have the minimum of minus loglikelihood.
Let‘s recap: our models assign probabilities to our data, we take the negative of the logarithm of these probabilities and we sum all those numbers together. The model which has the minimum value is the best one (because is the one with the maximum likelihood). We can interpret this value as an error value, something that tell us how much far we are from the best model. To get the best model we need to find the model which minimize our error function.
In the next note I will analyze with more details what this error function is: it turns out in fact that this error function is something called cross entropy. After this little detour I will go back to our procedure to calculate the best parameters for our model.
To share this page click on the buttons below;

